The US housing market has experienced a sporadic series of highs and lows since the onset of the pandemic in early 2020. The pandemic, and ensuing ultra-low mortgage rate environment, helped spur home demand across the county. Over the last 18 months, there has been a reversal as mortgage rates rapidly climbed from sub-3% to 7%. The effect has been mixed across different markets, urban vs suburban/rural, and product types, single-family vs condominium, but overall home sales have declined. Nevertheless, the homeownership rate in 2022—the most recent year for which data is available—is higher than the 5 years leading up to the pandemic.
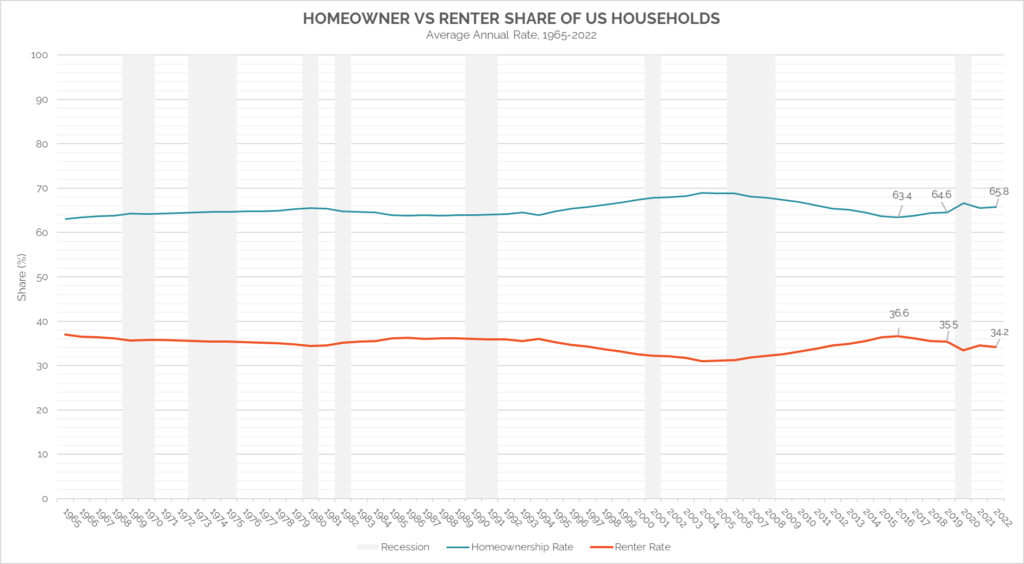
The rate of homeownership has steadily grown since 1965, peaking in 2004 during the run up to the financial crisis and subsequent collapse of the housing market in 2007-2009. Homeownership rates declined following the housing crisis, bottoming out in 2016 when the share hit a five-decade low at 63.4%. The graph below details the annual average share of homeowners versus renters between 1965 and 2022. There is a sharp uptick in homeownership in 2020; however, the pandemic disrupted the US Census Bureau’s Current Population Survey and Housing Vacancy Survey data collection operations in 2020 and 2021 such that data for those years are considered unreliable. To account for the disruption, the years called out are 2016 (the low), 2019 (the year before the pandemic), and 2022 (the most recent year with available data). Since 2016, the rate of homeownership in the US has grown from 63.4% to 65.8%.
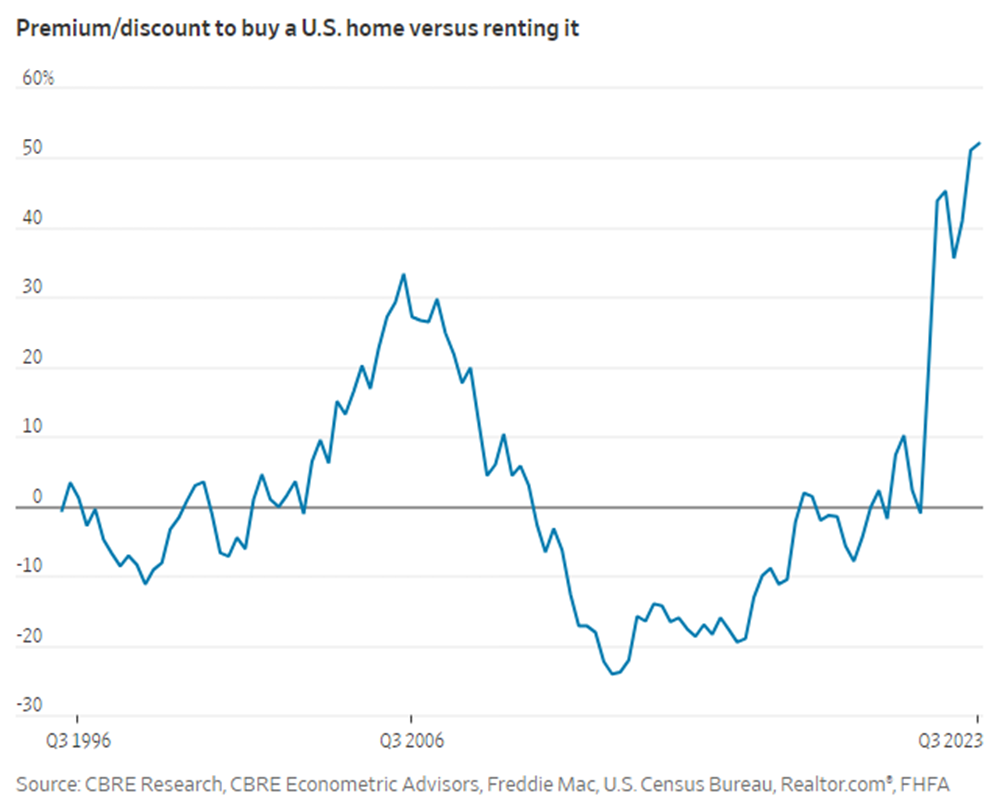
Despite the country’s high homeownership rate, there has never been a more expensive time to buy instead of rent. According to a CBRE study quoted in the WSJ, “the cost of buying a home versus renting one is at its most extreme since at least 1996. The average monthly new mortgage payment is 52% higher than the average apartment rent.” The graph on the following page illustrates the premium or discount between buying a home versus renting it in the US.
Historically, the average cost of buying versus renting a home was more or less the same. In the immediate run up to the financial and ensuing housing crisis of 2007-2009, home buying was also significantly more expensive than renting; however, the premium was about half of today’s. Following the crisis, low mortgage rates and high inventory made it cheaper to own during the 2010s. This all shifted again in 2022 when the rapid rise of mortgage rates, from sub 3% to 7%, and constrained supply and buoyed the cost of home buying. A person taking out a $500,000 loan today at 7% would have a monthly payment that is 58% higher than if they had purchased the same house in 2021 at a 3% rate. Rental rates have also increased since 2021, but at a much slower rate (9.3%).
Additional Sources:
- U.S. Census Bureau, Homeownership Rate in the United States [RHORUSQ156N], retrieved from FRED, Federal Reserve Bank of St. Louis;
- Ryan, Carol. n.d. “There’s Never Been a Worse Time to Buy instead of Rent.” WSJ.
- “October 2023 Rent Report.” n.d. Rent. Research. Accessed November 1, 2023
All information is from sources deemed reliable but no guarantee is made as to its accuracy. All material presented herein is intended for informational purposes only and is subject to human errors, omissions, changes or withdrawals without notice.


