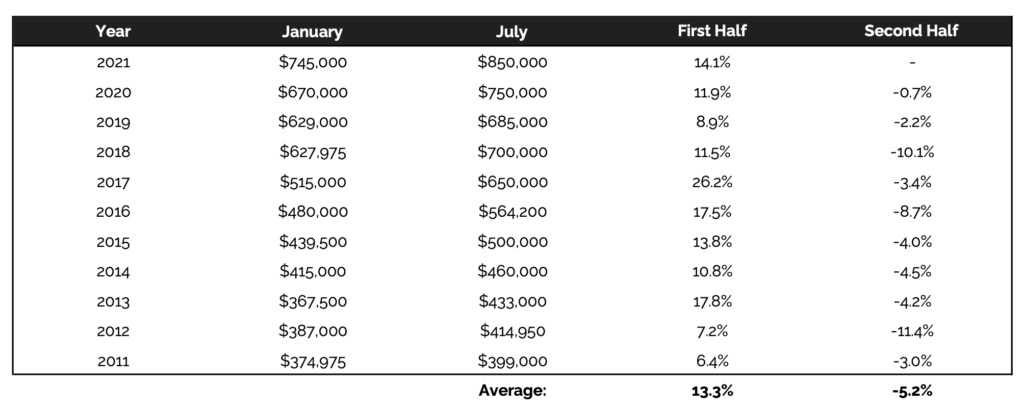
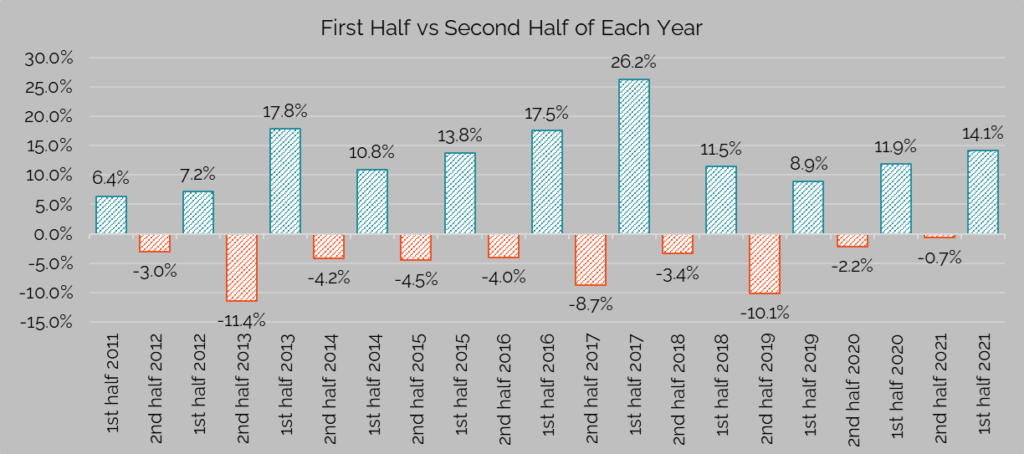
Everyone knows that seasonality plays a role in home sales, but the magnitude of the effect is often overlooked. The table and graph below compare the change in monthly median price between January and July (first half), and between July and the following January (second half), in each year. As shown, not only is the differential noticeable (an average of 13% vs -5%), every first half has been positive, and every second half has been negative for the past decade!
A few notes about the data: The median prices below represent monthly median prices for single-family, detached homes. The choice to compare monthly median prices six months apart was deliberate. Most reported real estate metrics, such as year-over-year comparisons or moving averages, tend to mask the impact of seasonality.
All information is from sources deemed reliable but no guarantee is made as to its accuracy. All material presented herein is intended for informational purposes only and is subject to human errors, omissions, changes or withdrawals without notice.


