Over the last five years, homes in Manhattan have, on average, sold at a discount of 8.2% off the list price. With the exception of the mid-2000s, when new developments averaged a small premium over the asking price, condos, co- ops, and new developments have consistently sold at an average discount ranging from 0.5% to 16%, peaking during 2009 amidst the financial crisis.
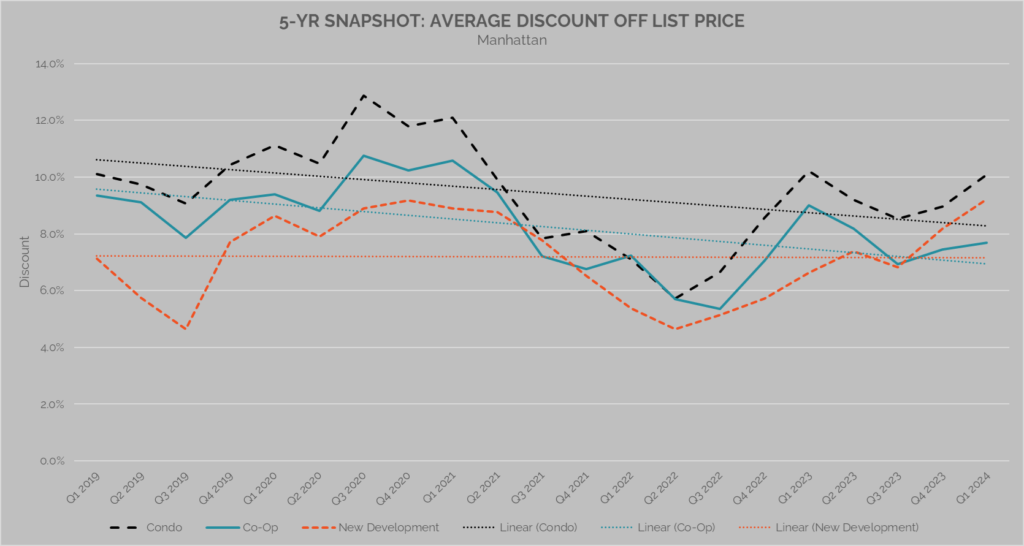
The chart below tracks the average discount per segment on a quarterly basis over a five-year period. It includes each quarter’s average discount and trendlines for each product type, detailing the general direction of discounts over the observed period.
Resale Condos
Over the last five years, resale condos have received the largest average discount relative to co-ops and new developments. The average discount peaked at 12.9% in Q3 2020 and reached its lowest in Q2 2022. The sharpest uptick occurred between Q2 2020 and Q3 2020, coinciding with the onset of the pandemic and the initial upheaval of the housing market. The trendline for resale condos shows that, despite quarterly volatility and a recent uptick, the average discount has decreased over the last five years.
Co-Ops
Co-ops comprise the largest share of Manhattan’s housing stock. Over the last five years, the general trend for co-ops suggests that discounts have decreased, with quarter-to-quarter movements largely mirroring the resale condo market. The average discounts for co-ops and resale condos converged during the first half of 2022. Over the last two quarters, co-ops have recorded the lowest discount (7.7% in Q1-24).
New Developments
New developments typically receive the smallest discounts off the list price, although concessions, a common negotiating tool during the purchasing process, are not reflected in the discount rate. Concessions can include paid closing costs, covered HOA fees for a period of time, storage space, etc. that are utilized when absorption rates are slower than targeted. In the second half of 2021 and again in mid-2023, the average discount for new developments converged with that of condos and co-ops, even surpassing the latter at various points. Over the last two quarters, the average discount for new developments was higher than co-ops (9.2% in Q1-24). The trendline for new development suggests discounts have remained relatively consistent over the last five-years compared to co- ops and resale condos.
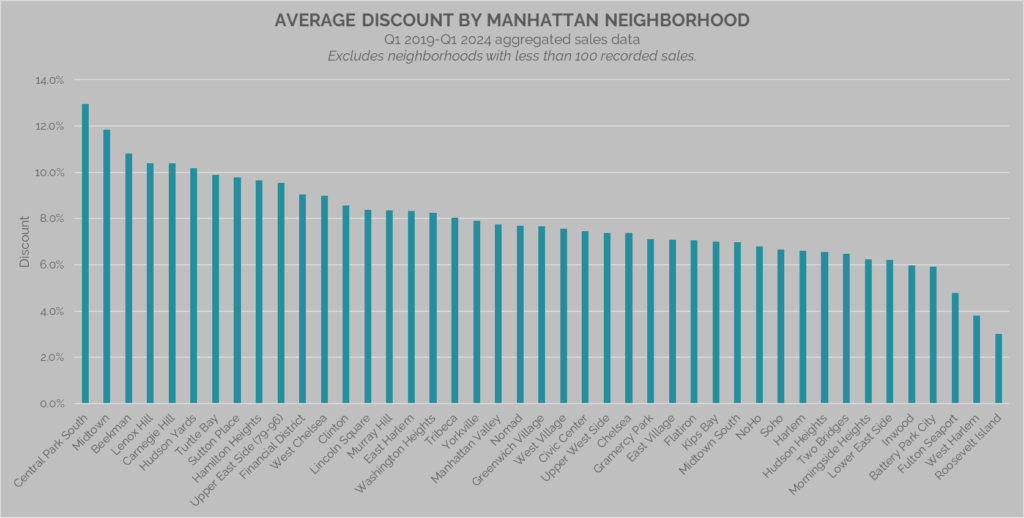
The table below represents the average discount over the last five years by neighborhood. The data includes all three product types and excludes neighborhoods with fewer than 100 transactions.
Looking at individual Manhattan neighborhoods, homes in Central Park South, Midtown, Lenox Hill, Carnegie Hill, and Hudson Yards have recorded the largest average discounts over the last five years, all over 10%. Meanwhile, homes on Roosevelt Island, West Harlem, and Fulton Seaport have recorded the lowest average discounts, all under 5%. While the discount rate can signal the strength or weakness of demand for homes in a specific neighborhood, it is not always the case. In many examples, a low average discount suggests the homes in that area are better priced for market conditions whereas a high average discount suggests they may be overpriced and lingering, giving buyers more bargaining power.
All information is from sources deemed reliable but no guarantee is made as to its accuracy. All material presented herein is intended for informational purposes only and is subject to human errors, omissions, changes or withdrawals without notice.


